Canopy Scan Mode
A new way to task and capture satellite imagery of earth — no phone calls, no spreadsheets.
Umbra Space, a leading provider of space imaging, set out to make satellite data truly accessible and on‑demand. Canopy was created to let users get imagery without the antiquated hurdles of phone calls and spreadsheet orders.
Users
U.S. government agencies, sovereign nations, image resellers, analytics companies, journalists, and scientific researchers.
Problem
Users struggled to order from the platform and use technical parameters. The app needed a polished, consistent design and the MVP missed key features—like ordering at scale. Customers leaned on our support team due to shortcomings.
Goals
Steer Canopy from an MVP to a fully-featured product. Introduce new functionality and offerings to help serve customer’s missions. Improve usability and iterate on the design to make the app a joy to use.
Impact
Define and ideate
Through competitor analysis and stakeholder interviews across the satellite imagery industry, I discovered no existing UI pattern for this type of interaction—making this a first-of-its-kind design challenge. Without direct competitors to reference, I looked to adjacent use cases:
- Polygon drawing tools in mapping applications
- Property boundary tools on real estate platforms
- Linear measurement tools in GIS software
Users needed a simple start-to-end point drawing interaction that felt natural on a map interface while providing the precision required for satellite tasking.
Early directions & iterations
Before the version that shipped, I tried a simpler model: place a footprint of a predefined length, then adjust it with a slider. Testing it with real users showed it was cumbersome and didn't hold up, so I moved to a point-to-point drawing interaction instead.
Whether that new interaction actually worked came down to how it felt to drag on a real map, not how it looked in a static frame, so Figma couldn't answer it. I built it as a coded prototype in a sandbox instead, using Claude to handle the complexity of custom draw controls so I could test ideas at the speed the project needed. Mock data was real footprint geometry and coordinate math, the same shape the production API would eventually need.
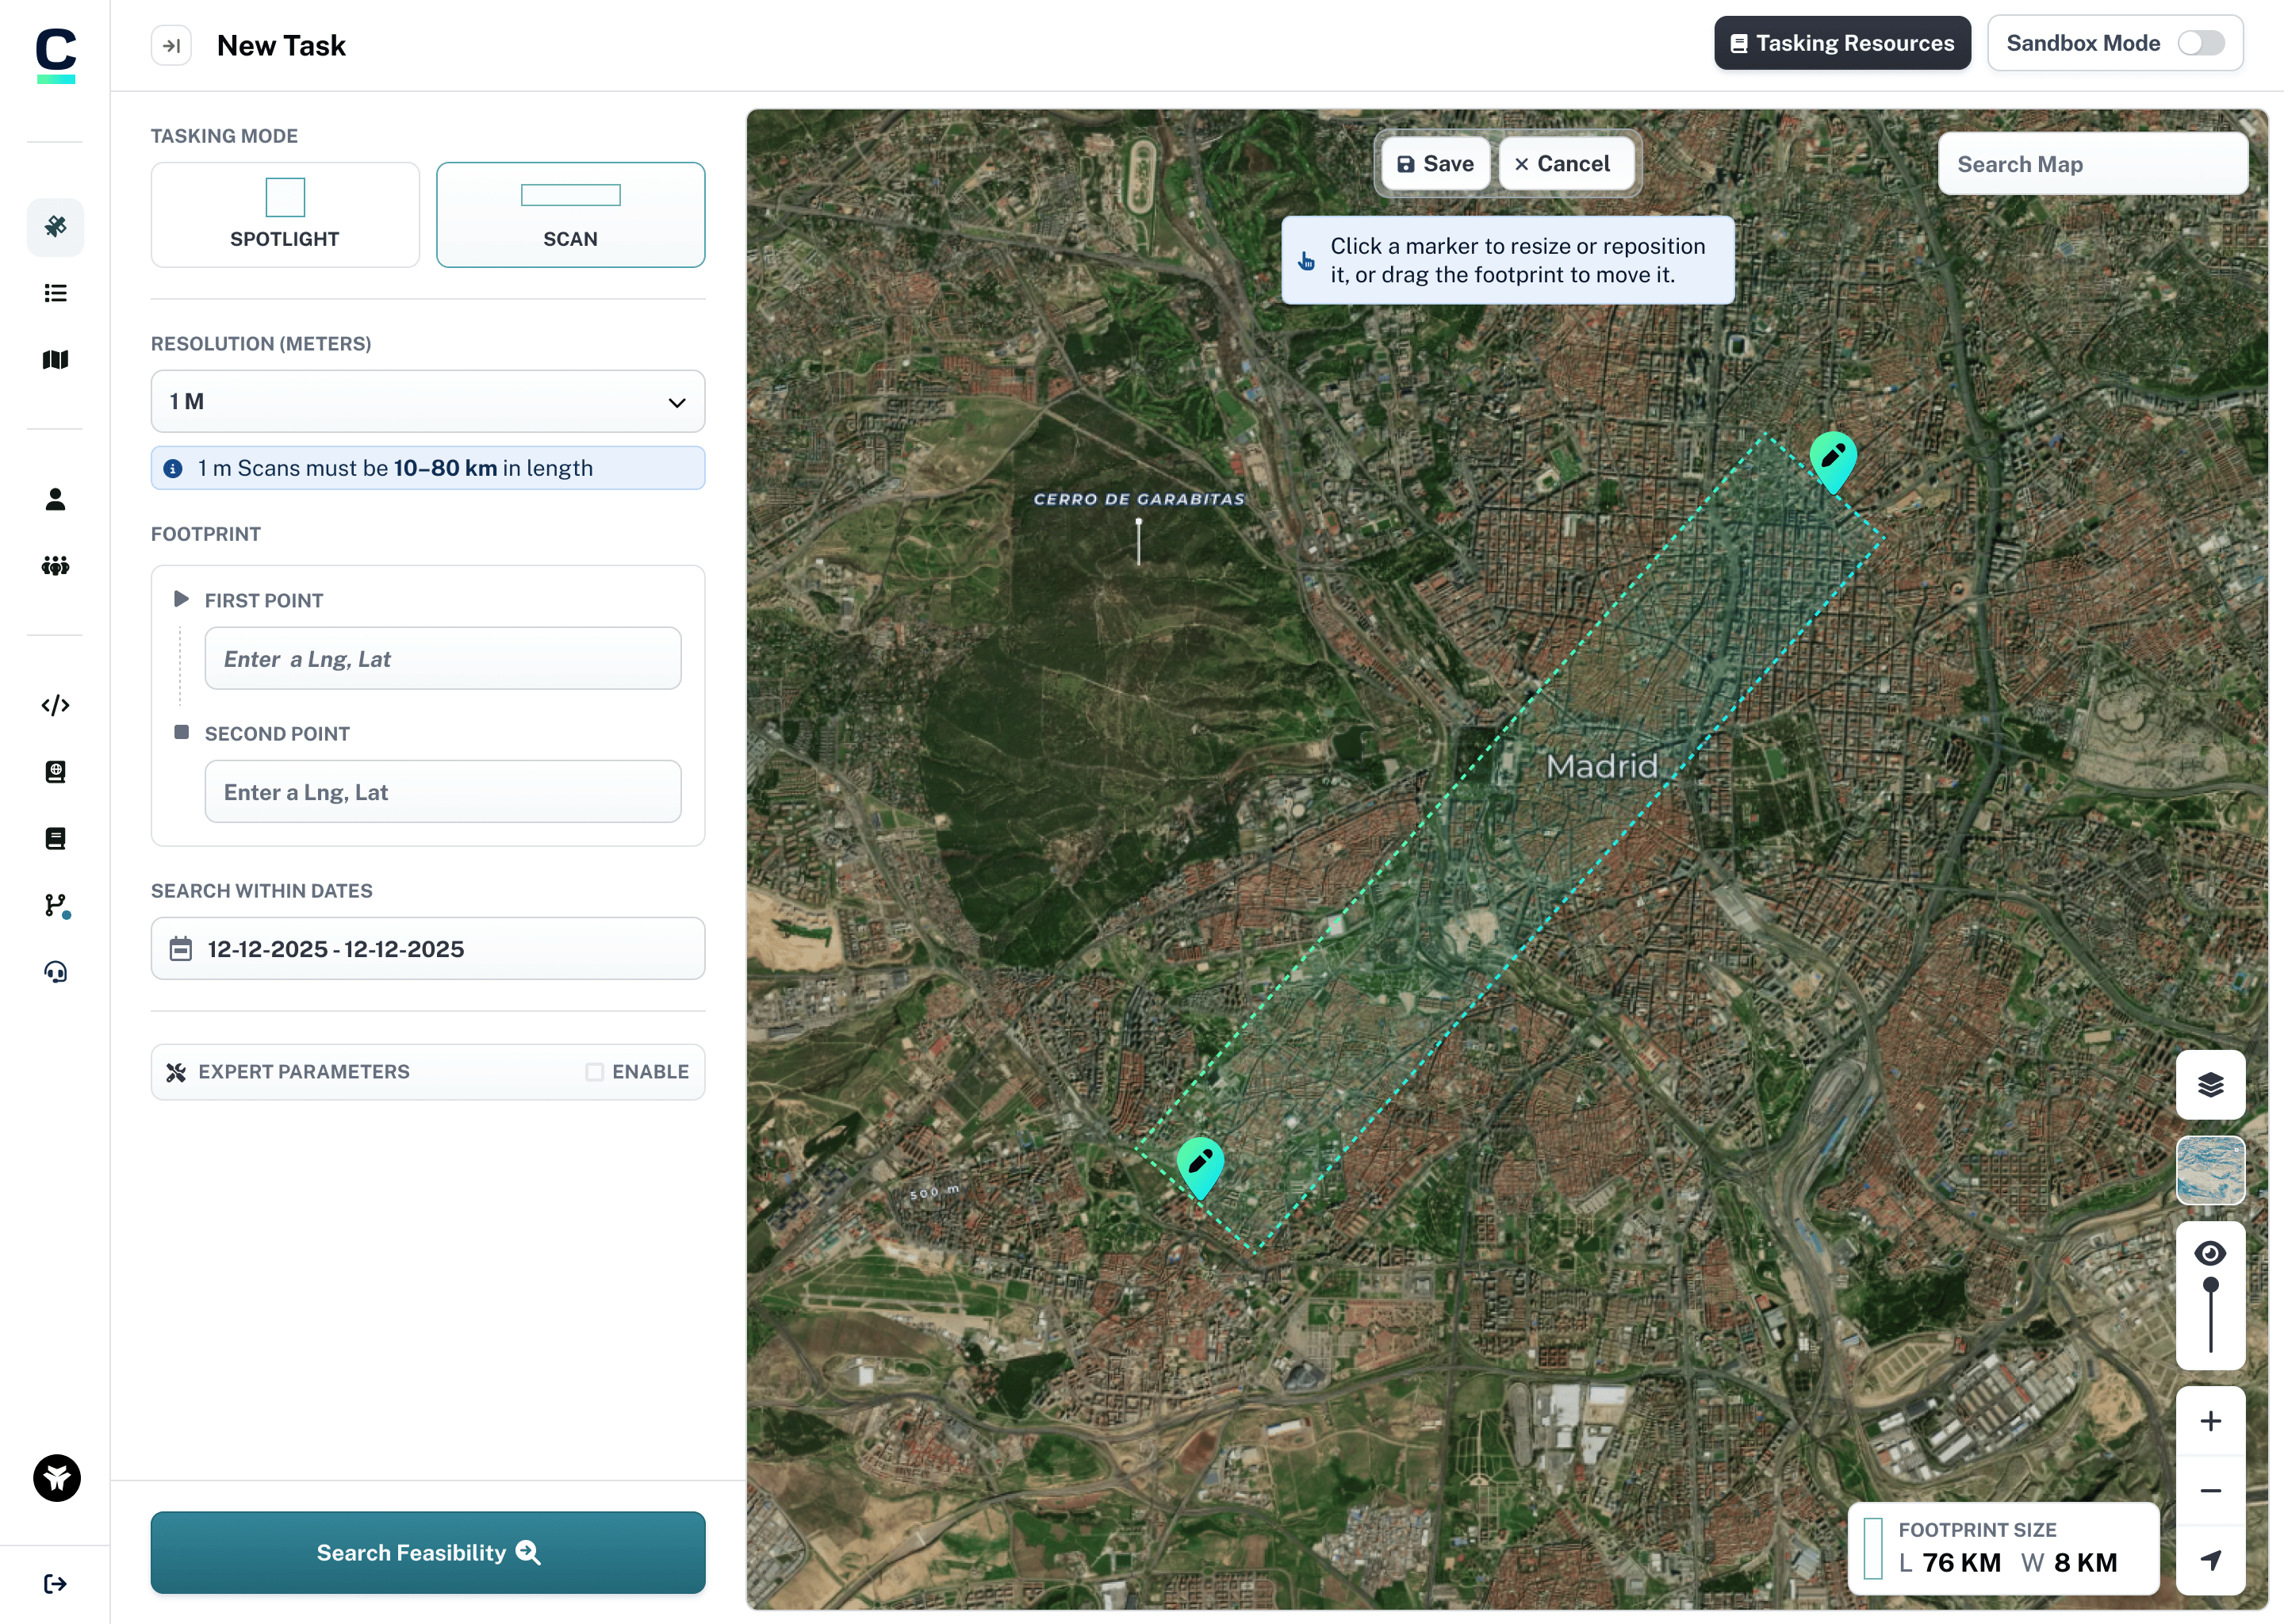
The first version drew directly on top of Mapbox Draw's default controls. It quickly became clear those controls weren't built for drawing a rectangle with a predefined width, so the interaction didn't hold together. The second version rebuilt the drawing model around the full rectangle and its width instead of a center line, so the scan area was visible as you drew it. The third added the ability to edit an existing footprint and refined the interaction styling based on how it actually felt to use.
Deliverables
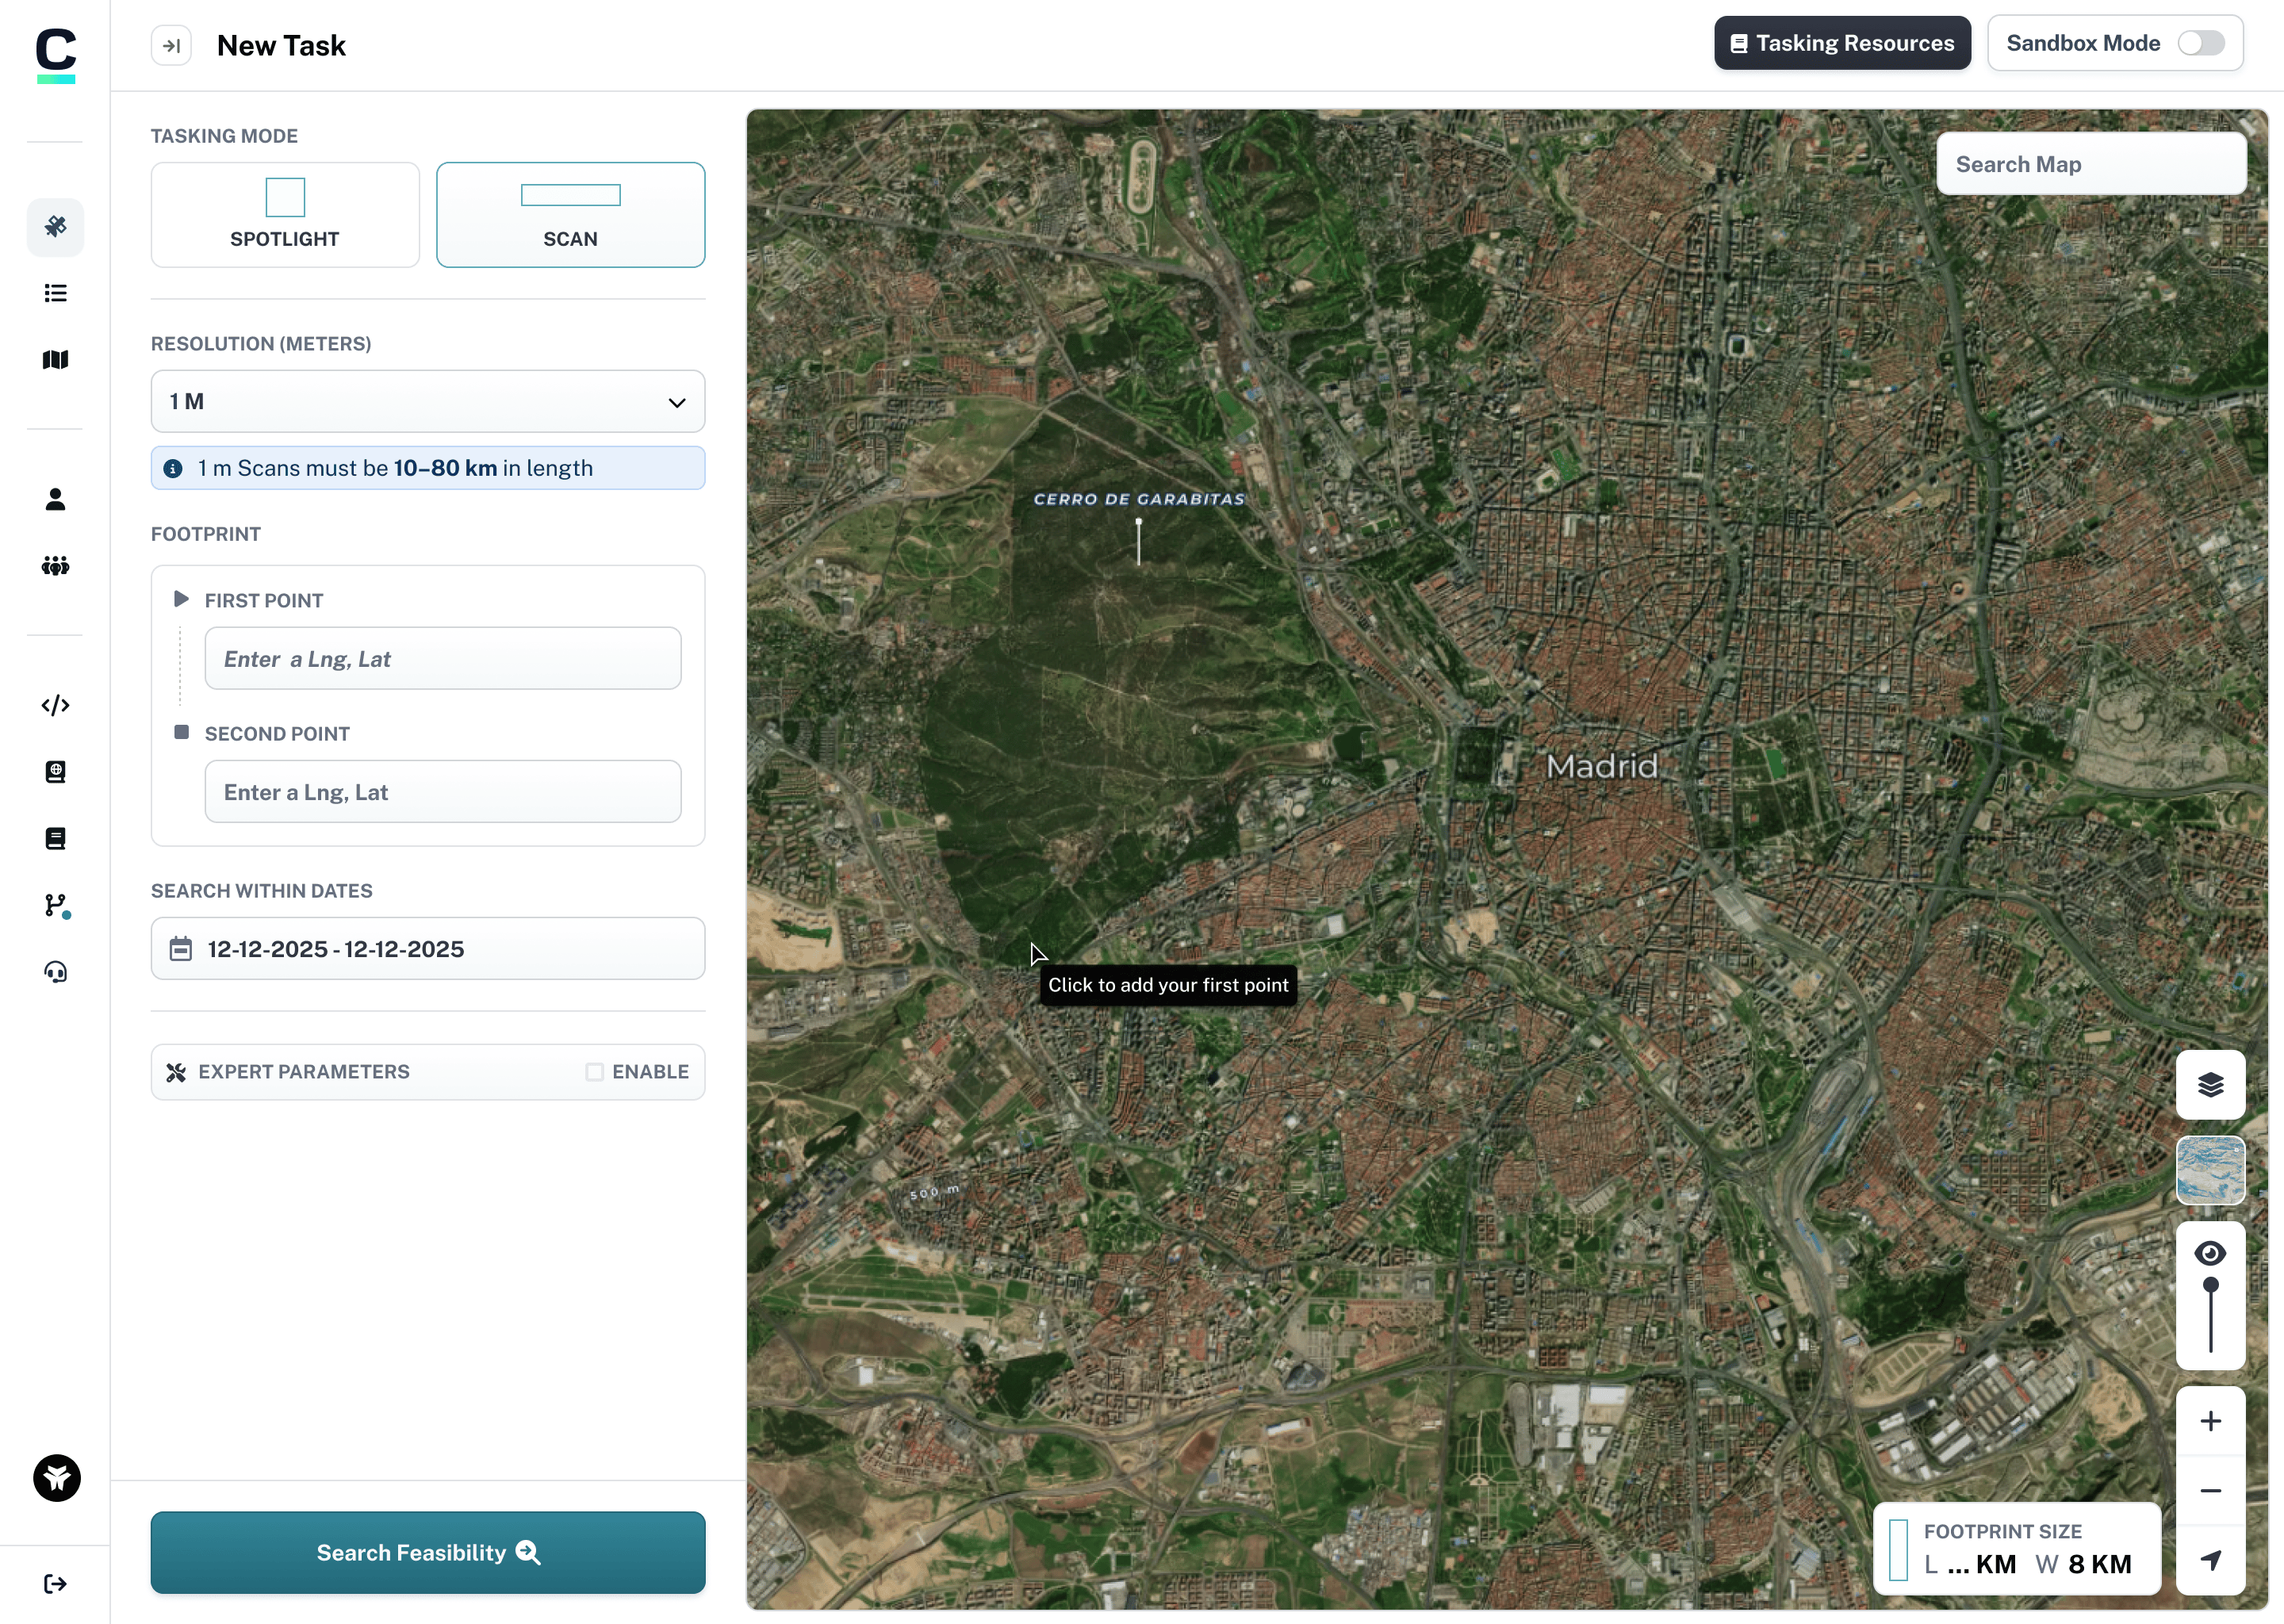
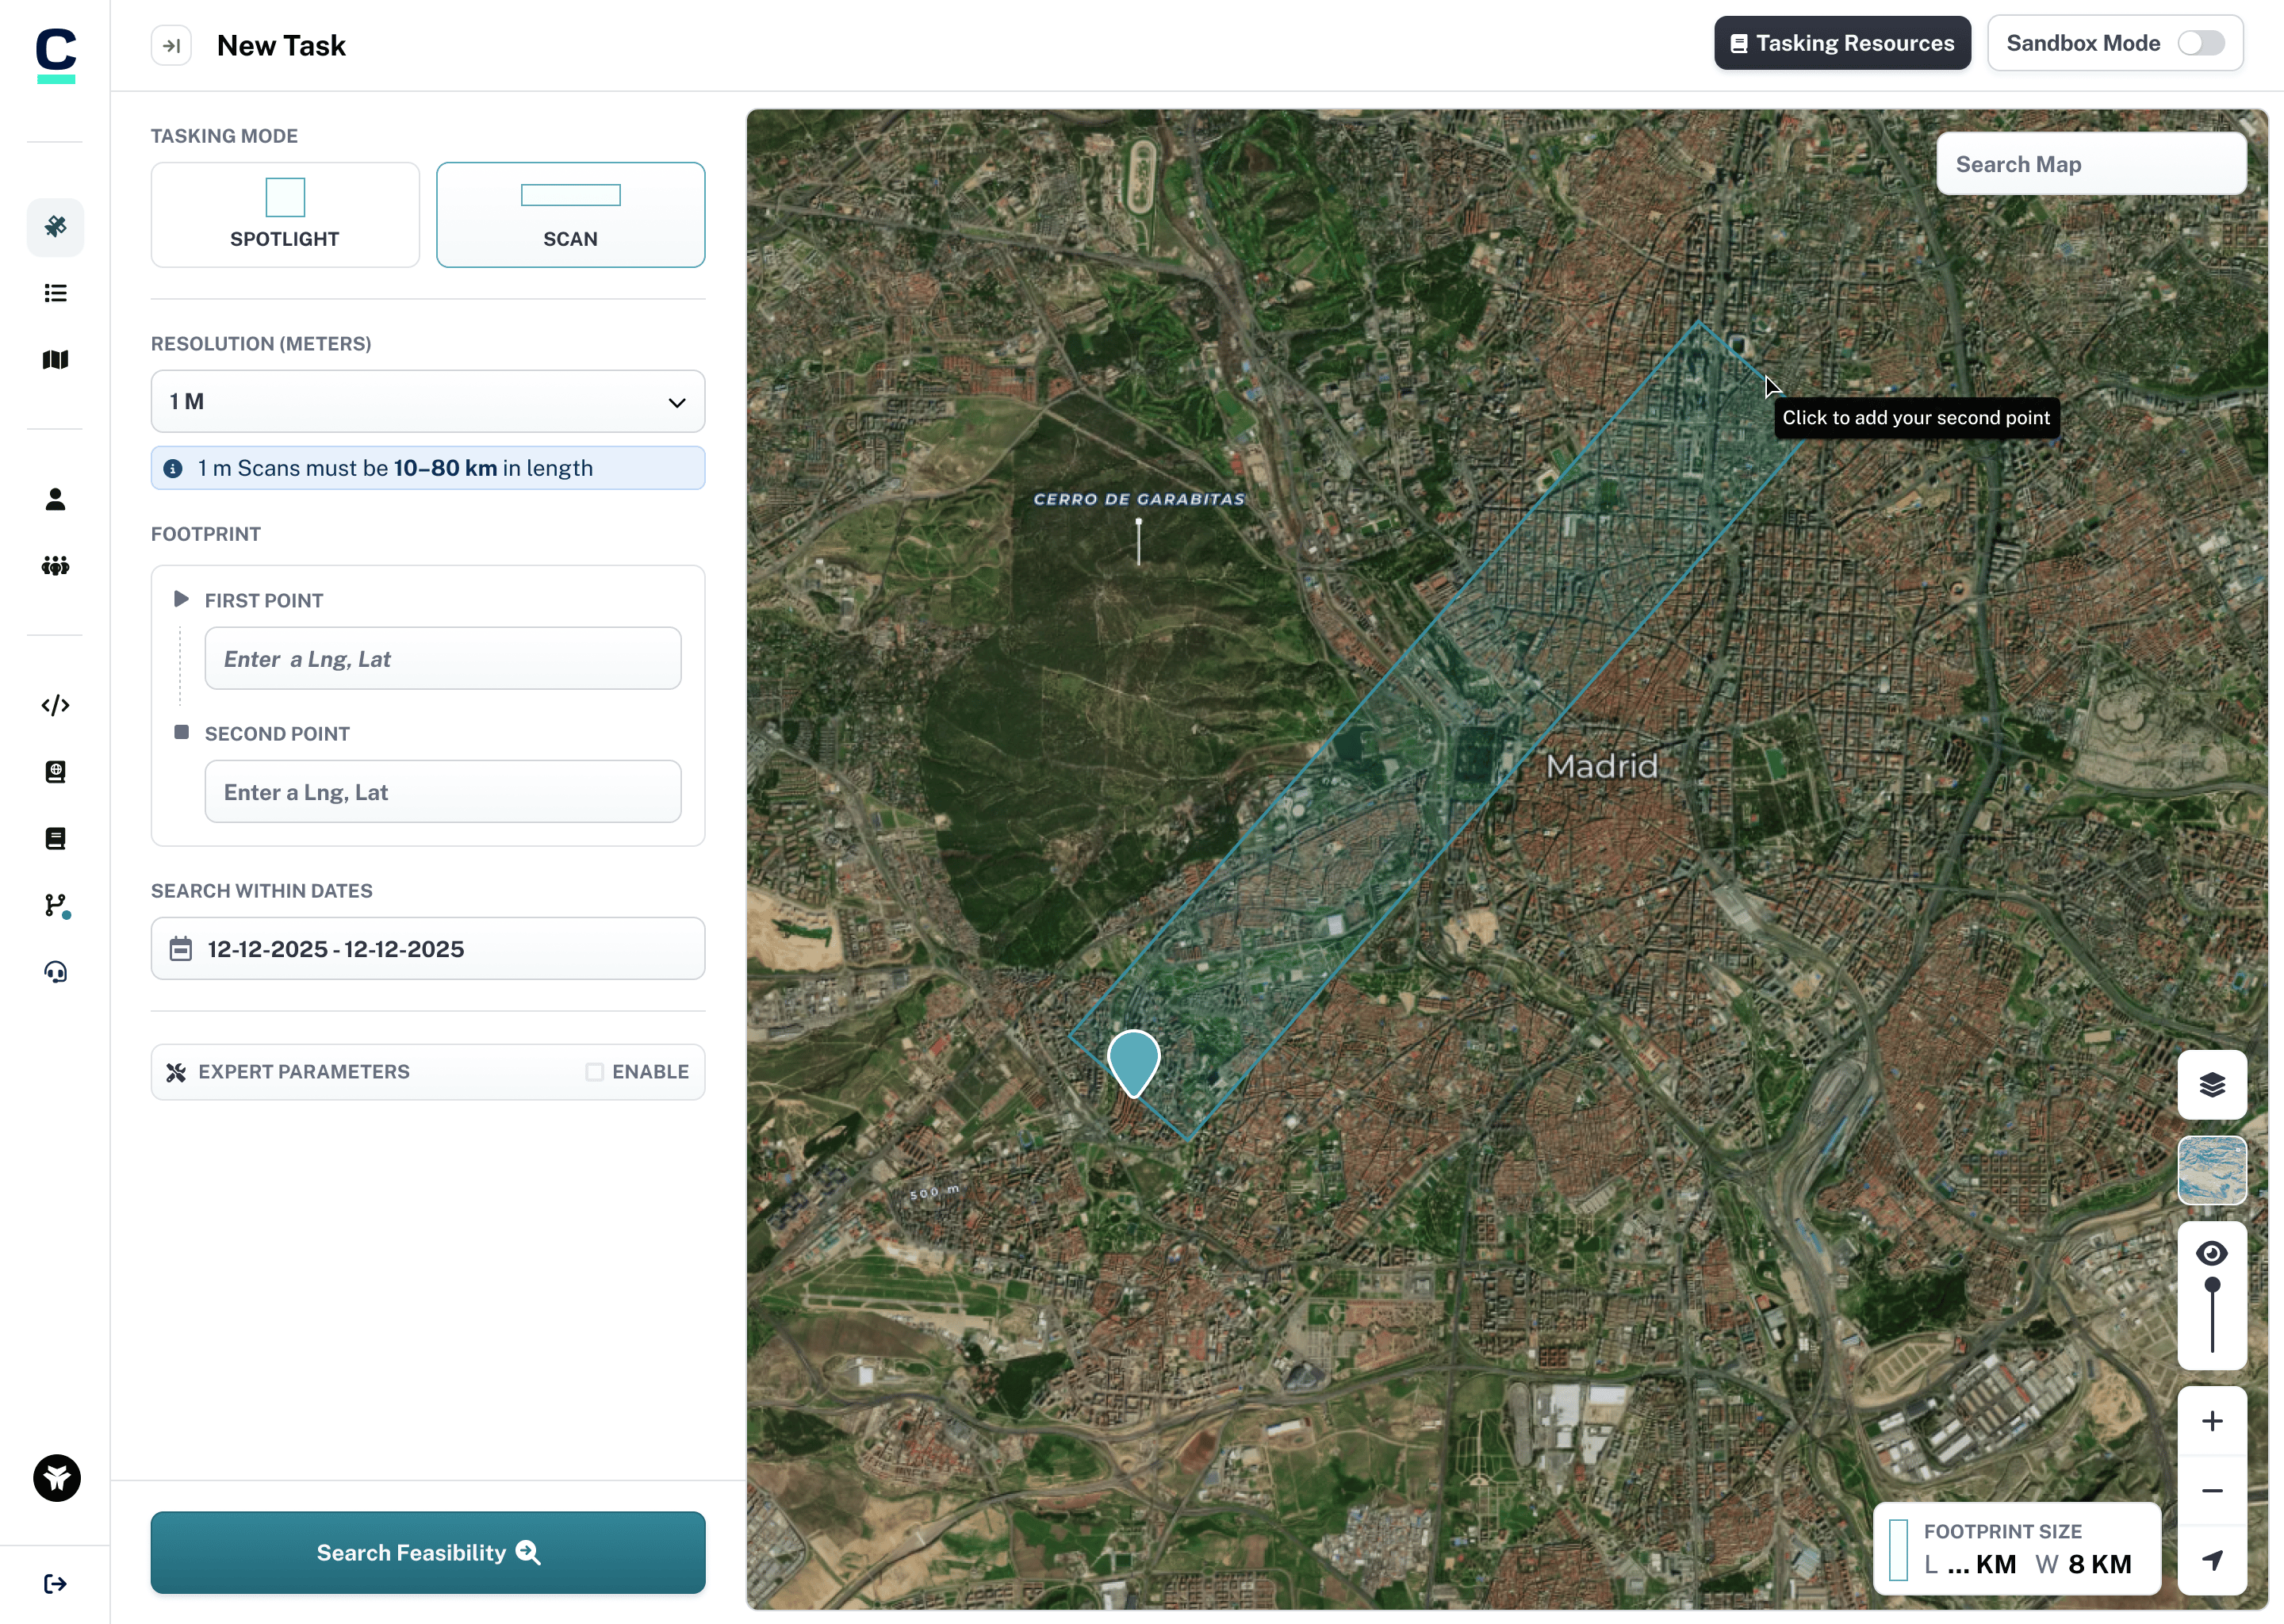
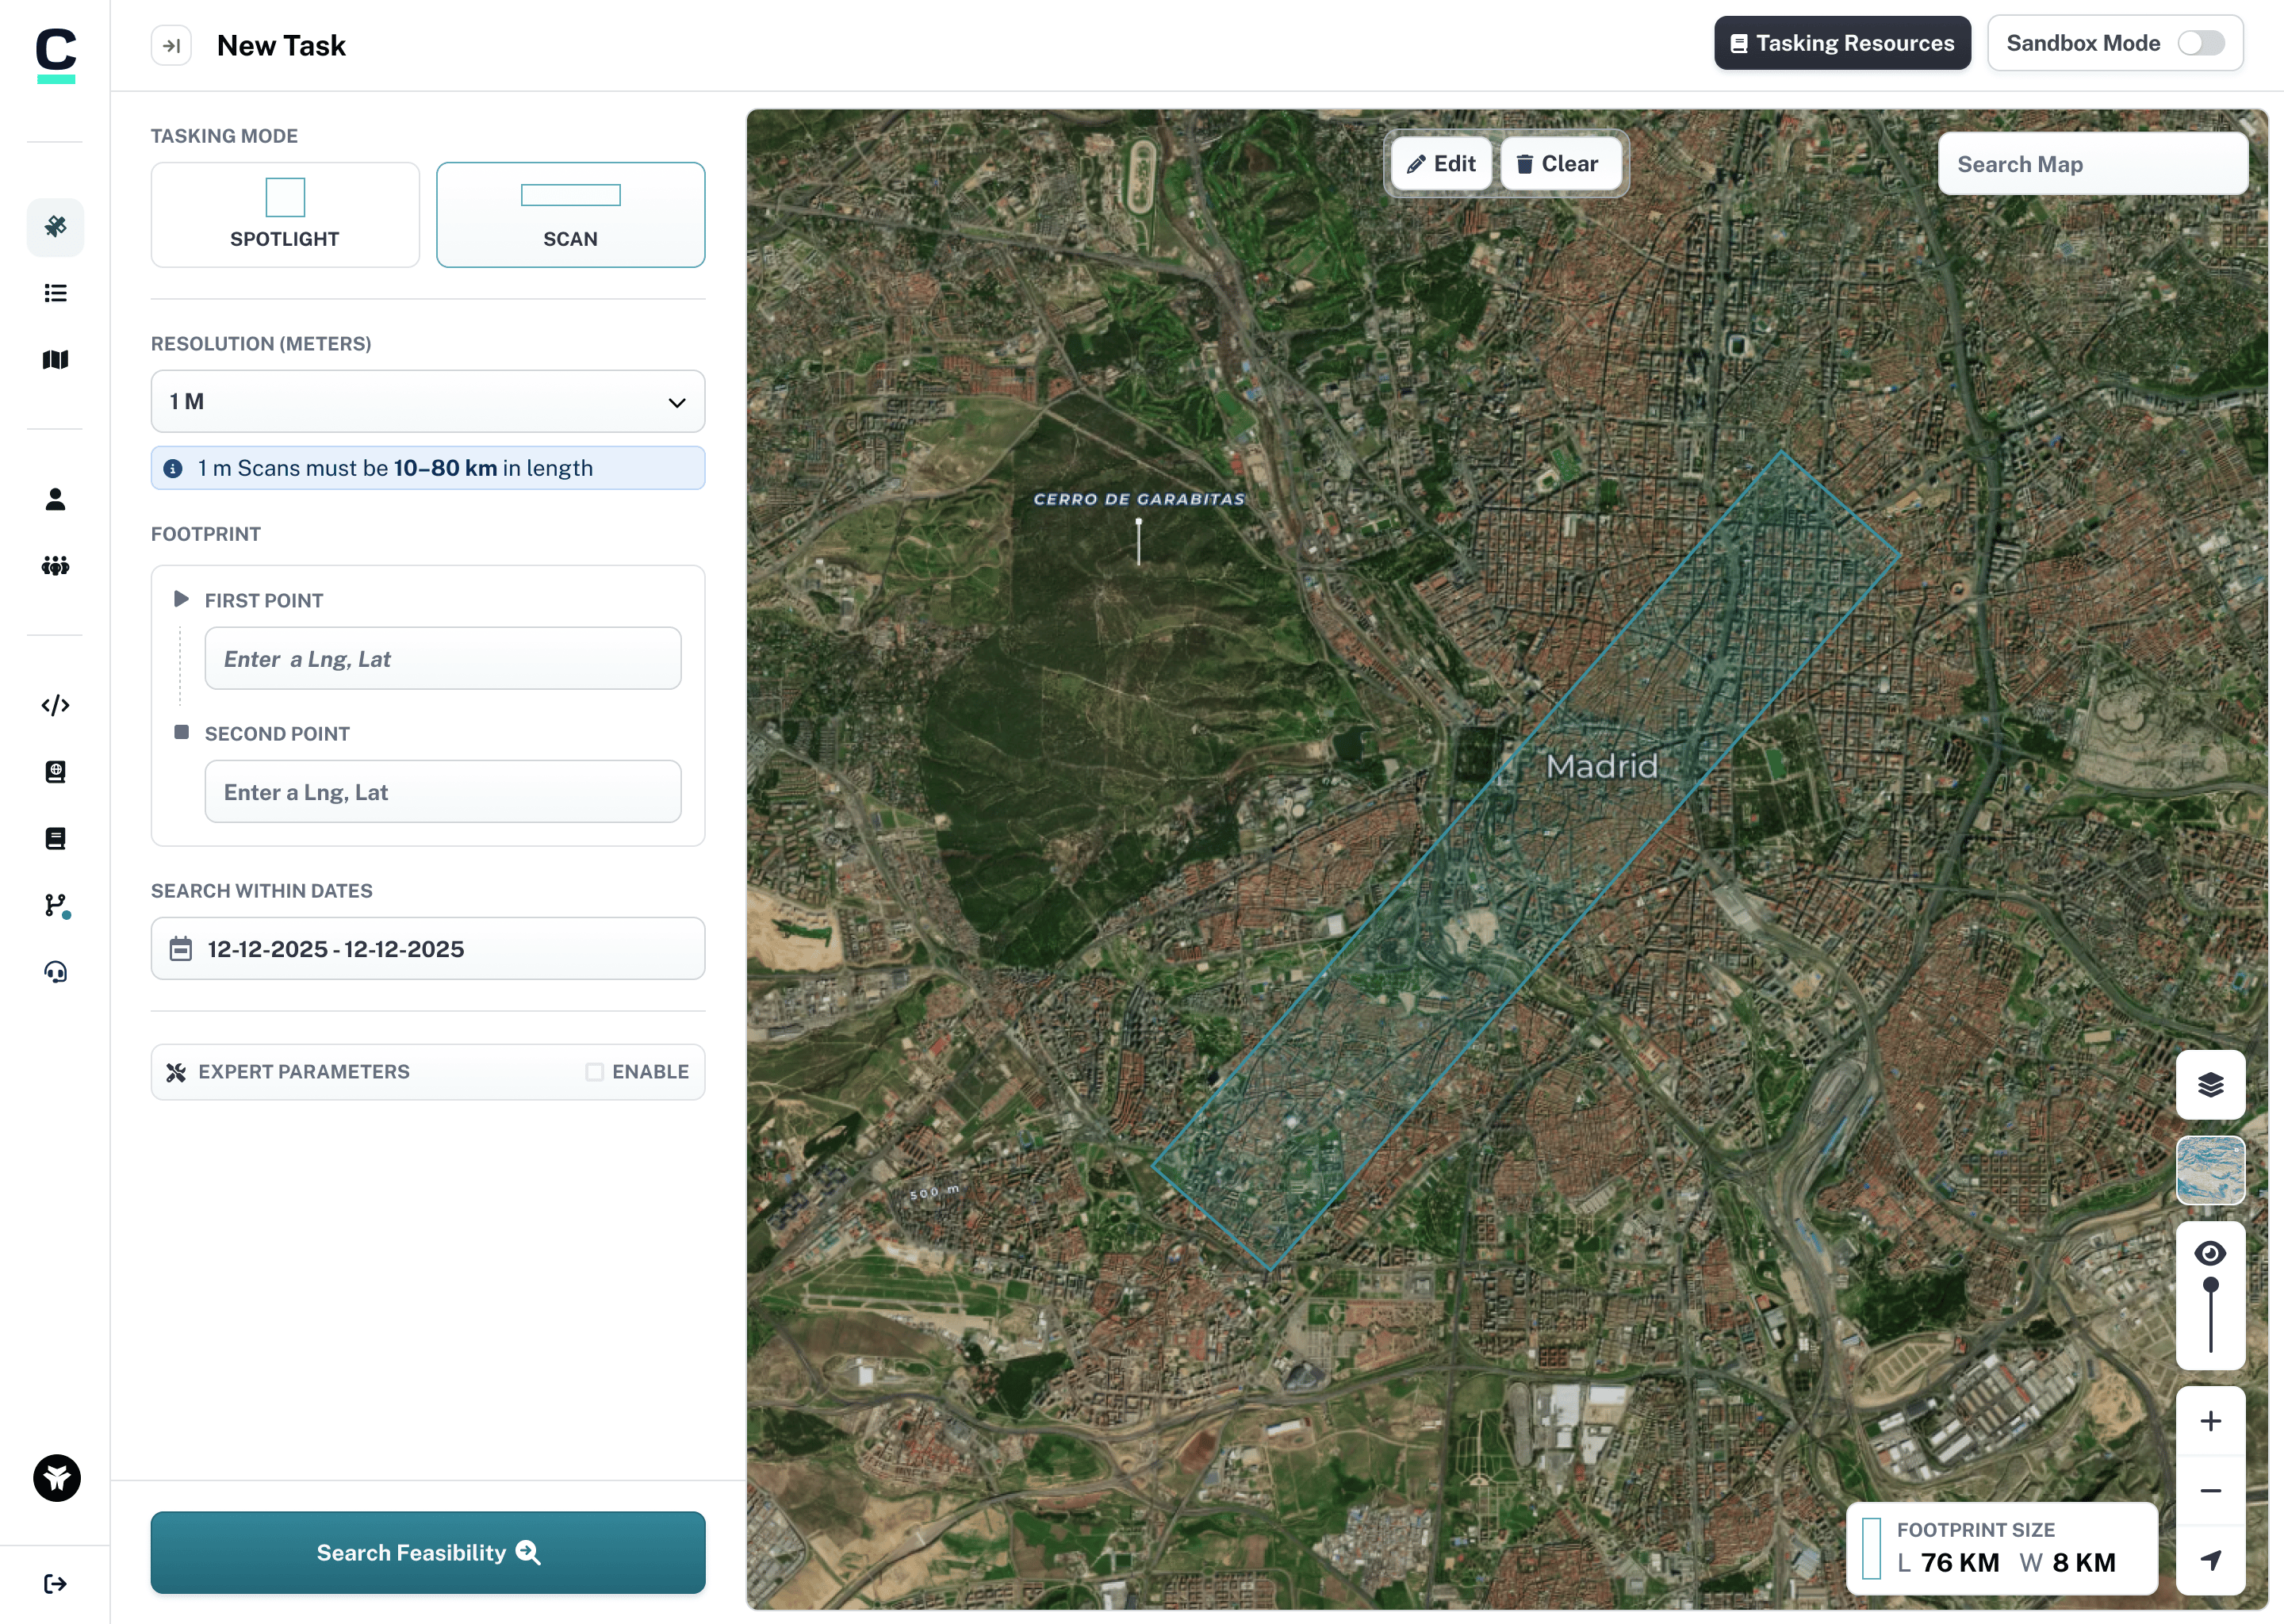
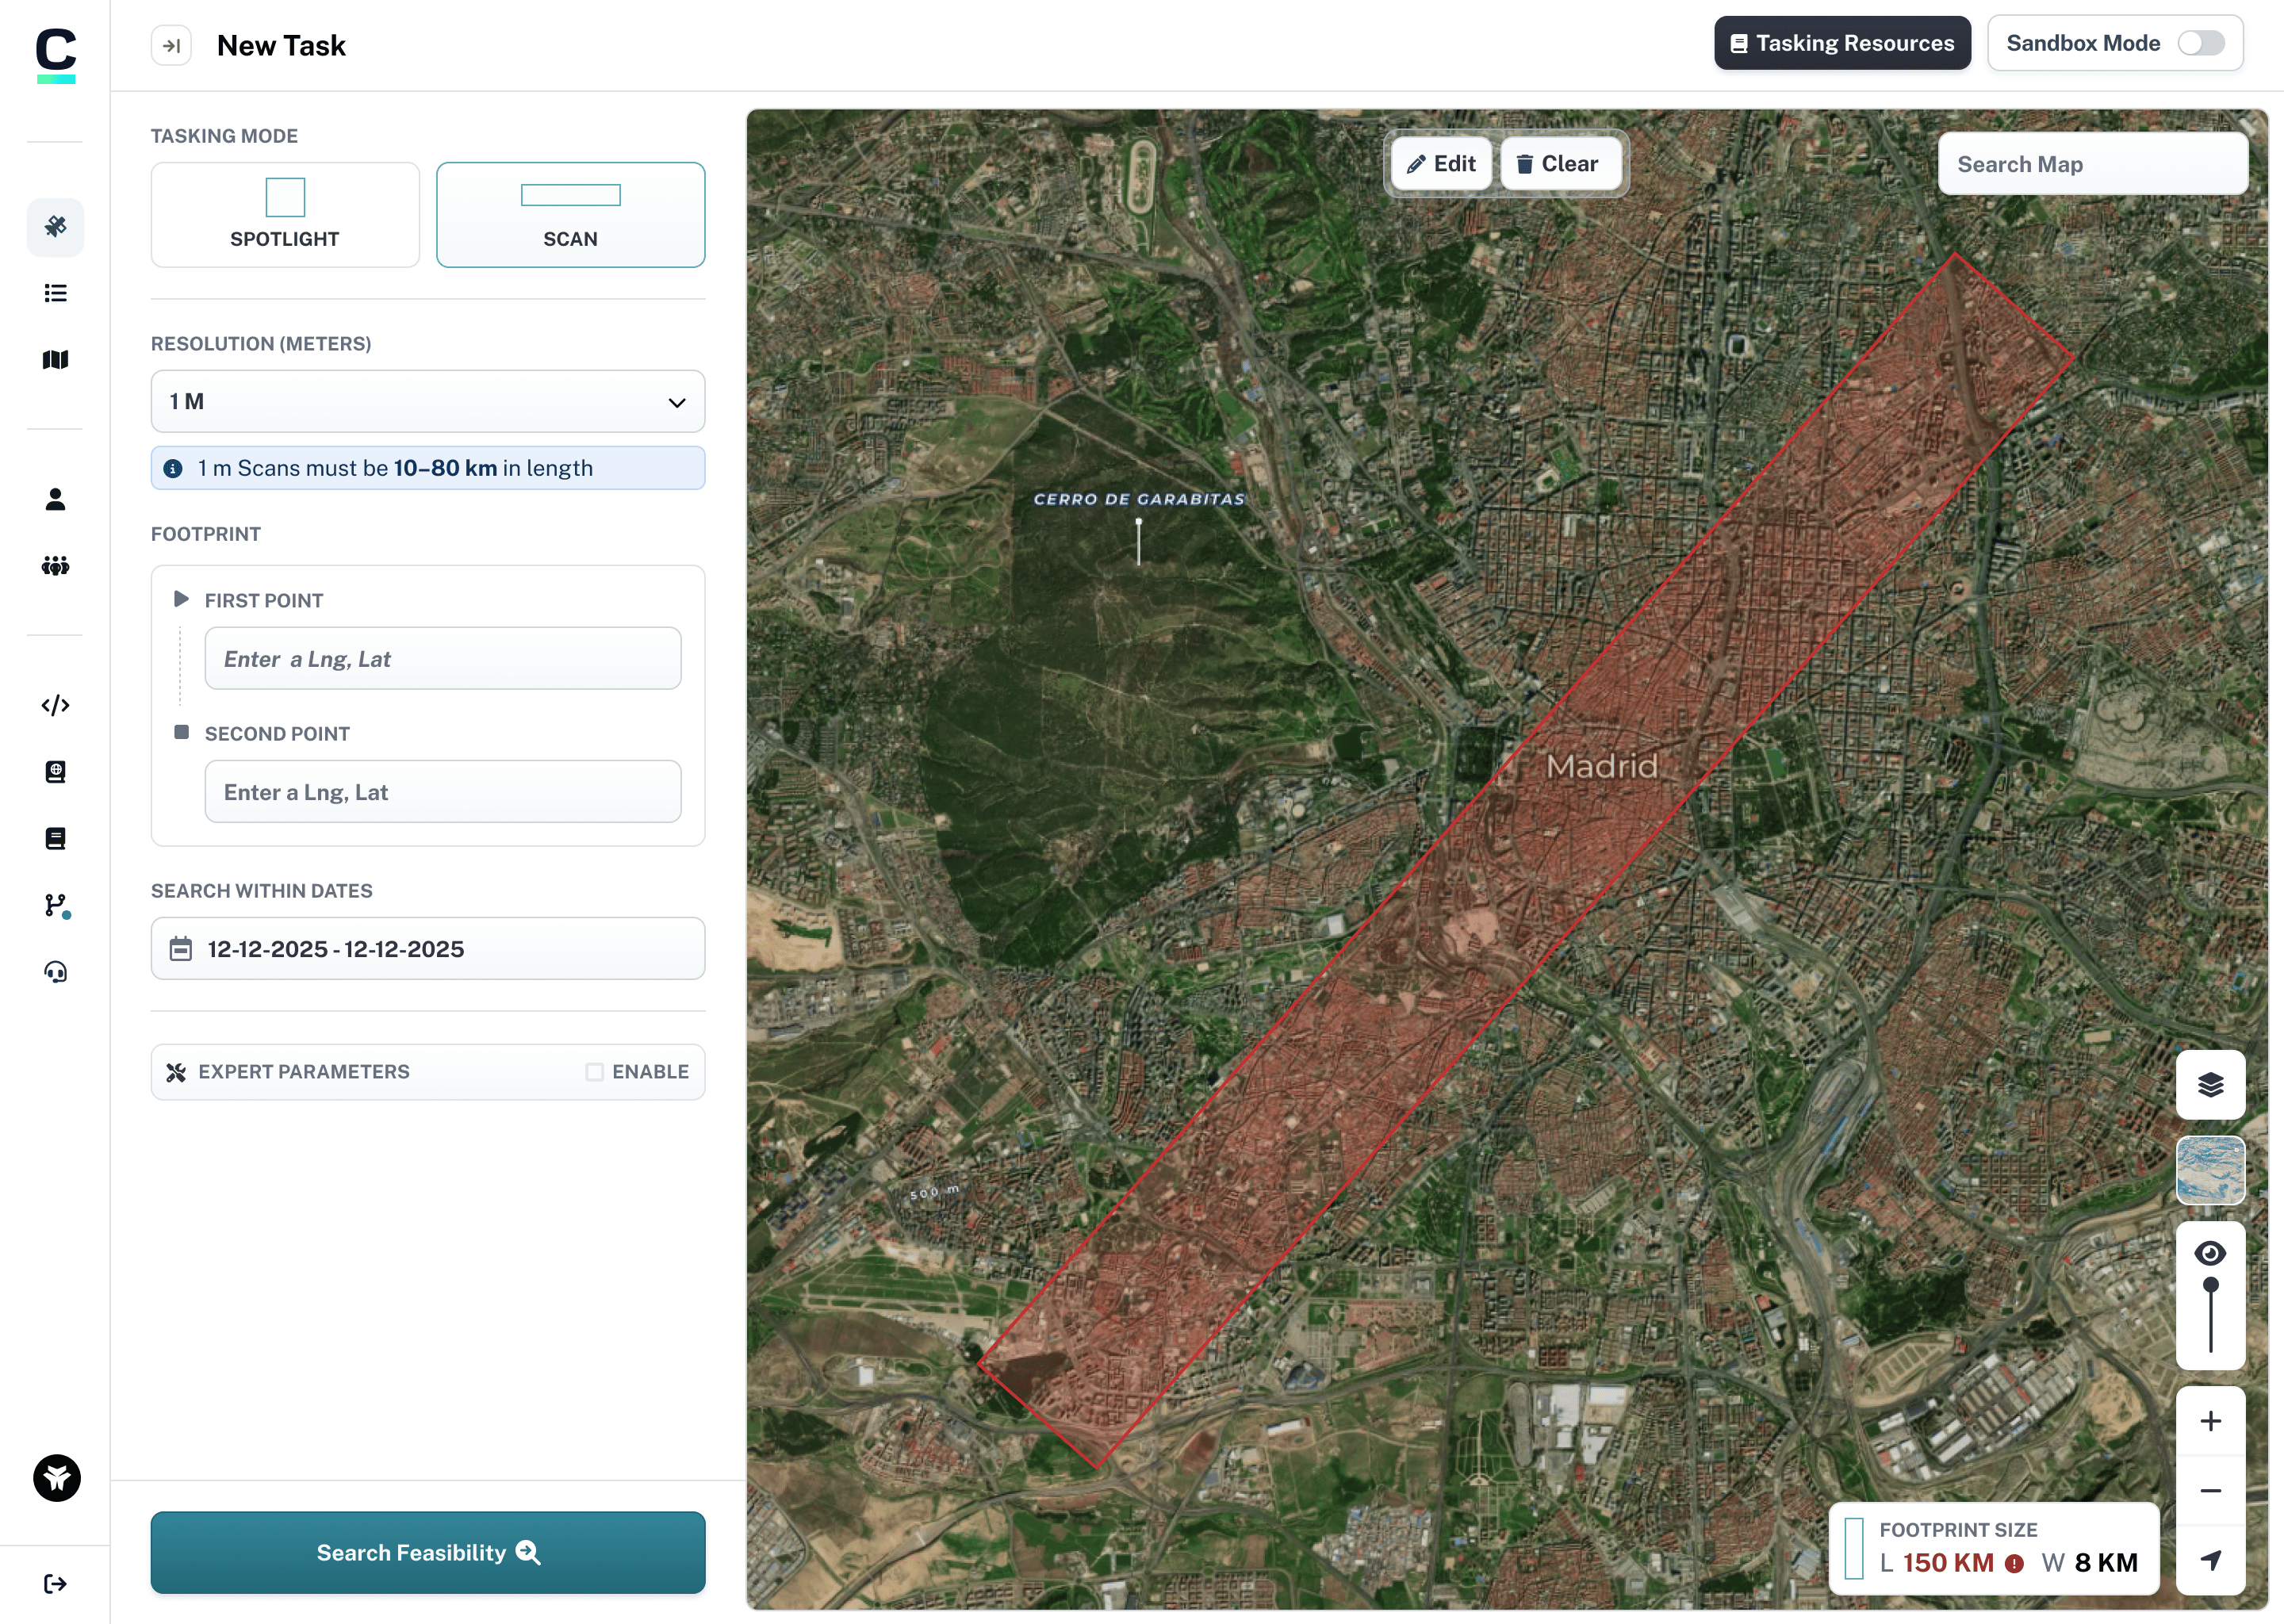
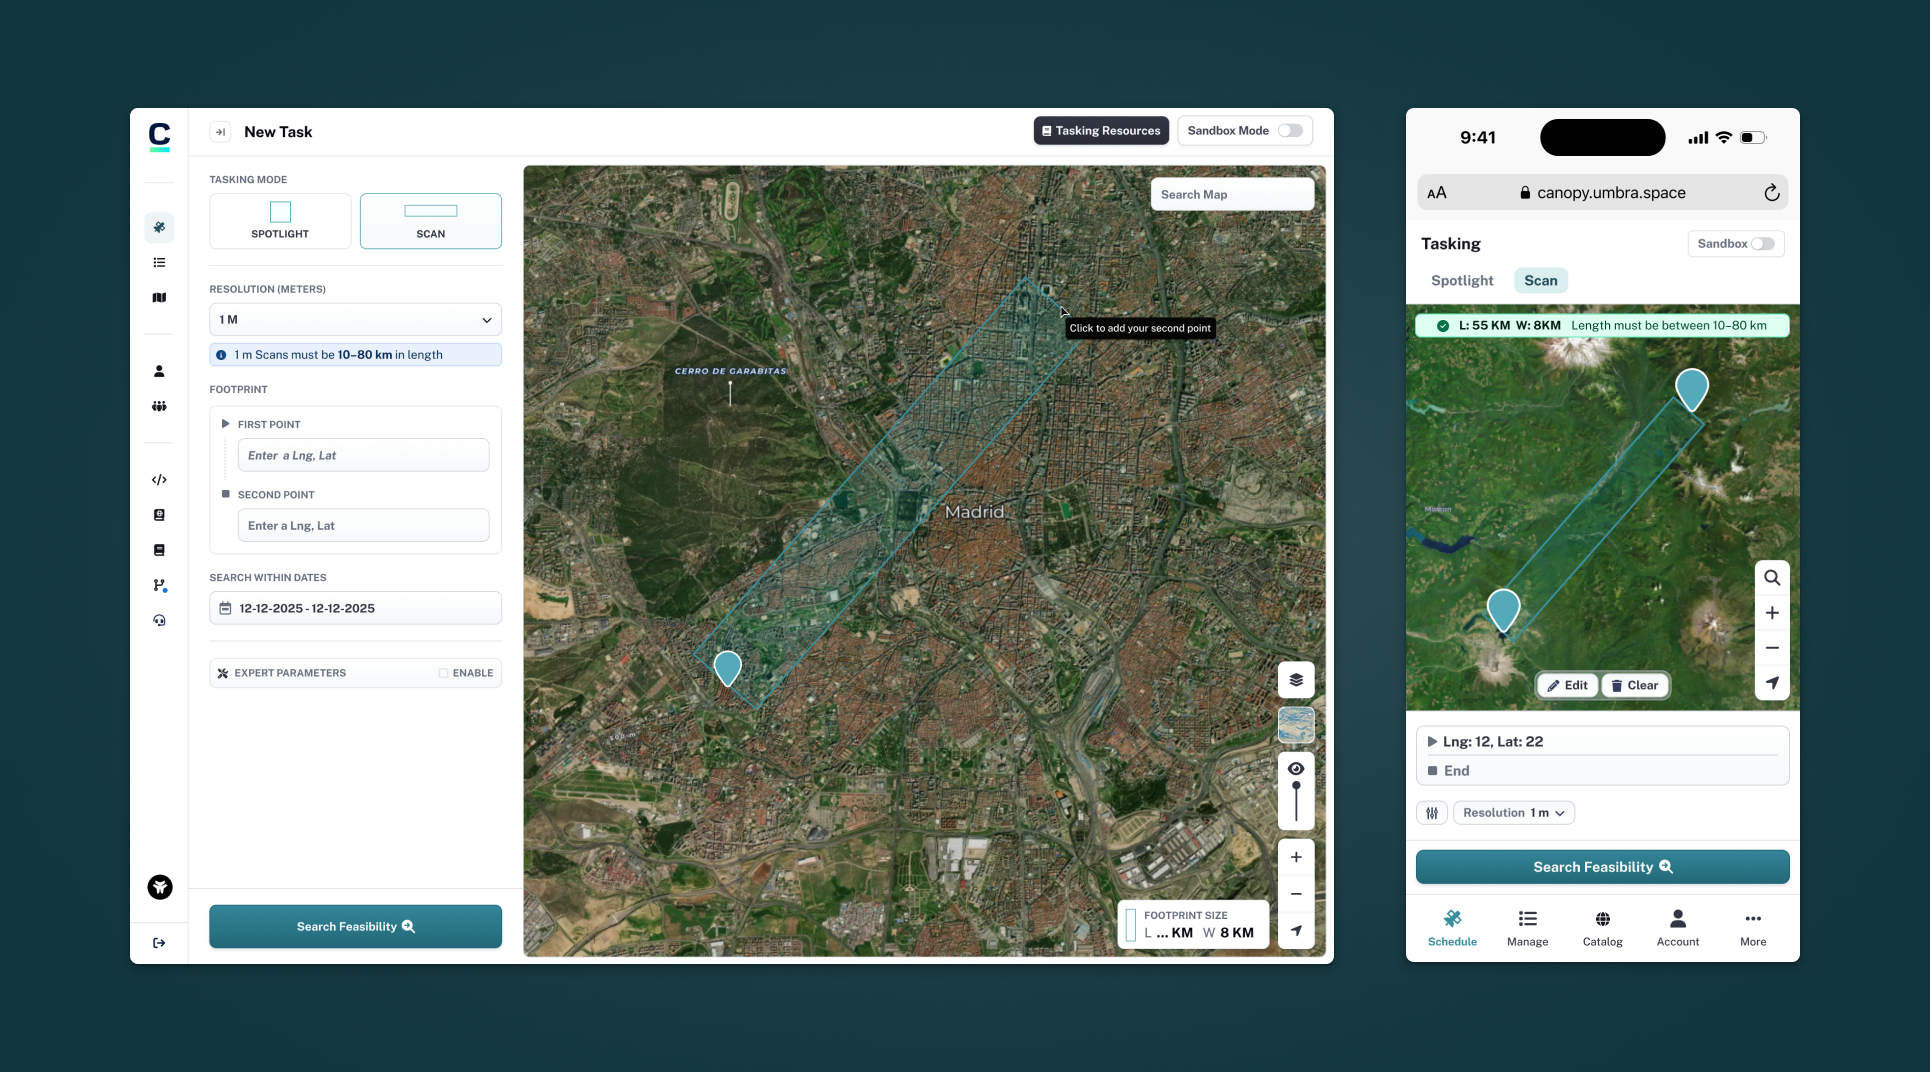
Through iterative testing with internal stakeholders, I landed on a direct path drawing solution: click a start point, drag to set direction and length, then click to confirm the end point.
- Matched how users conceptualized the scan
- Aligned with API data structure (start/end coordinates + width)
- Provided immediate visual feedback
- Supported any orientation naturally